Introduction to Logging with Fluent-Bit and OpenSearch
I’m planning on a talk discussing opensource C2 (command & control) frameworks like Havoc and Mythic. To be complete, there really needs to be a good environment to test and demonstrate against. And to be thorough, this environment should at least have some basic security controls in place. As I keep finding poor documentation online, these blog posts will help to consolodate some lessons learned.
Logging
Logging is the most critical security control to implement. Since it’s a given endpoints will get compromised, a centralized logging system is the only way to get insight into how the compromise occured. Proper logging is also critical to semi-automating common alerts and responses. For this series of blogs, the logging solution is Fluent Bit (log collector) feeding Data-Prepper (a replacement for LogStash) and OpenSearch (Amazon forked ElasticSearch) combined with OpenSearch Dashboards (Amazon forked Kibana).
A simple four virtual machine lab environment will be the reference:
- Logging VM: Docker containers with data-prepper, opensearch, and opensearch dashboards
- Windows Server 2022 VM: Simple Active Directory
- Windows 10 Pro domain joined VM: the main target of our logging adventure
- Kali Linux VM: Interface to the web front end of the logging system
Logging with Fluent-Bit, Data-Prepper, OpenSearch, and OpenSearch Dashboards
There’s a wide range of free* (with varying levels of ability before incuring charges) and opensource logging solutions. A very common one is Elastic Stack (aka ELK). I’ve decided to base this environment and blog posts on the Amazon forked version called OpenSearch. This is not intended to be advocating for one solution or another. I’m interested in learning how this forked version has changed and what it’s capabilities are. This post should hopefully help others with their initial setup when they’re evaluating it.
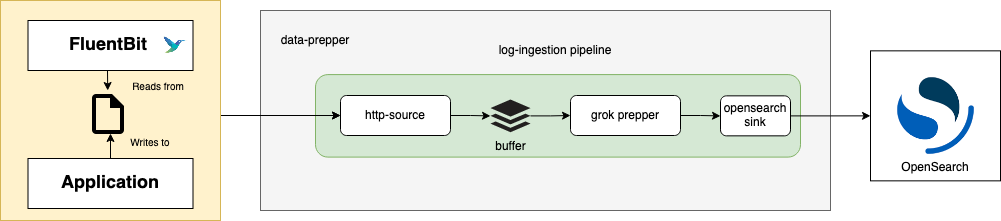
See Data-Prepper with Fluent-Bit
Fluent-Bit is our very light-weight log shipper that comes with pre-compiled version for Windows and Linux. Data-Prepper is our LogStash replacement and will enable us to define log pipelines that can standardize our logs and enrich them. It’s also an intermediate stage that can be scaled to accomodate an extremely large system of log collection. The only stage not discussed in these blogs, that would be needed to scale very large, is an intermediate buffering system. Some common solutions for that would be RabbitMQ, Kafka, or others. The logs would then be shipped into OpenSearch (Amazon forked ElasticSearch). At last we would navigate and manage the logs using OpenSearch Dashboards (Amazon forked Kibana).
Setup
A complete step-by-step description of setting up the VMs is beyond the scope of this blog post. I’m going to be focusing on logging.
Throughout this blog series, it is assumed this setup is being used in an isolated test environment. As such, we’ll be disabling some basic security controls the same as default examples. Of course don’t do this in a production system or if you’re going to be running over internet-accessible VMs. The two biggest controls being defered are TLS and usernames/passwords. The default OpenSearch user and password is admin/admin.
Logging VM
After setting up a Debian server VM with Docker, we’ll use the following docker-compose.yml file:
|
|
This is very similar to the example docker-compose.yml file supplied by the OpenSearch project. I’ve added static IPs to facilitate logging from the base OS as well as two different Data-Prepper ports to separate out Linux and Windows loging pipelines.
We also need (at least) two configuration files for Data-Prepper. One is for configuring the service and the other is for defining our logging pipelines. For now,
we’ll just use the very basic Data-Prepper configuration that disables SSL (data-prepper-config.yaml):
|
|
Our pipeline is going to be complicated enough to demonstrate features, but not complete by any means (log-pipeline.yaml):
|
|
There’s a bunch of important things to discuss here. First off, this does not demonstrate chaining pipelines together, which is likely to be needed when standardizing and enriching logs. See this official example for how that works.
This file contains two pipelines. It will be necessary at some point to spread your configuration between many files.
The number one most important thing that must be done in these pipelines is correctly calling out or creating an ISO8601 timestamp. If that is not done, your logs will not be in order and the important and useful features for searching and filtering will not be available. Also, if any logs enter your pipeline without the timestamp, they would then not be visible (in most cases) within Opensearch Dashboards.
The OpenSearch project generally uses ‘/’ notation within variables instead of ‘.’ - although, it will look like a ‘.’ in some places. So when you might want to use something like “login.type” you’ll often need to use “login/type”.
For the Windows log pipeline, make sure to use ‘TimeCreated’ as that is the field Fluent-Bit ‘winevtlog’ inputs will spit out. DO NOT USE ‘winlog’ as that is not compatible with application logs like “microsoft-windows-powershell”. You will not see an error if you try using ‘winlog’, but you will get very wierd and mostly incomplete logs. Technically, the timezone offset should probably be “xx” instead of “-0800”, but I did not get that to work correctly.
A very important and useful feature is to add the current date to your index. This lets you later archive or delete old data which will become critical as you run out of space. This index templating is not documented anywhere I’ve seen, except in the Github issue that originated it.
The last bit needed for the logging VM, is installing Fluent-Bit and creating a configuration file (fluent-bit.conf):
|
|
Notice we’re using the docker container IP here. That’s important to make sure running Fluent-Bit on the same host as the docker container will work. On any other host, use the IP assigned to the VM’s exernal network interface.
Windows VMs
There’s a lot of configuration I’m leaving out here as it’s not directly needed for logging. I will also assume you’ve installed sysmon. The one piece I will mention is enabling powershell script-block logging. Since our configuration is pulling from “Microsoft-Windows-PowerShell/Operational” where these logs come from. To do that, run
|
|
A simple way to install Fluent-Bit on Windows is to run the following commands (replace the executable filename with whatever version you’ve downloaded):
|
|
Make sure to set the logging VM IP under the Output section. This is the fluent-bit.conf file being used on Windows:
|
|
If you modify this file later, make sure to stop Fluent-Bit and delete the SQLite database (under \fluent-bit\bin\winevtlog.sqlite), or logs will often not get generated in OpenSearch
correctly.
Conclusion
This blog post discussed most of the configuration needed for a basic Fluent-Bit/OpenSearch logging lab. In the next blog post, I’ll be discussing set up of OpenSearch Dashboards and how to use it. Spoiler - it’s still almost identical to Kibana.
Comments
You can use your Fediverse (i.e. Mastodon, among many others) account to reply to this post.